Of all the questions scientists hope to answer about the new coronavirus sweeping across the globe, the most pressing is this: How deadly is it?
The only way to know is to figure out how many people have been infected — and that’s the real challenge.
More than 40,000 infections have been confirmed, but experts are certain there are at least tens of thousands more. Some cases haven’t been counted because patients didn’t have biological samples sent to a lab. Some never saw a doctor, and others had such mild symptoms that they didn’t even know they were sick.
Without a true picture of the total number of cases, it’s impossible to calculate a fatality rate. That’s why scores of epidemiologists and mathematicians are working to solve one of the most complex modeling problems of their time.
Advertisement
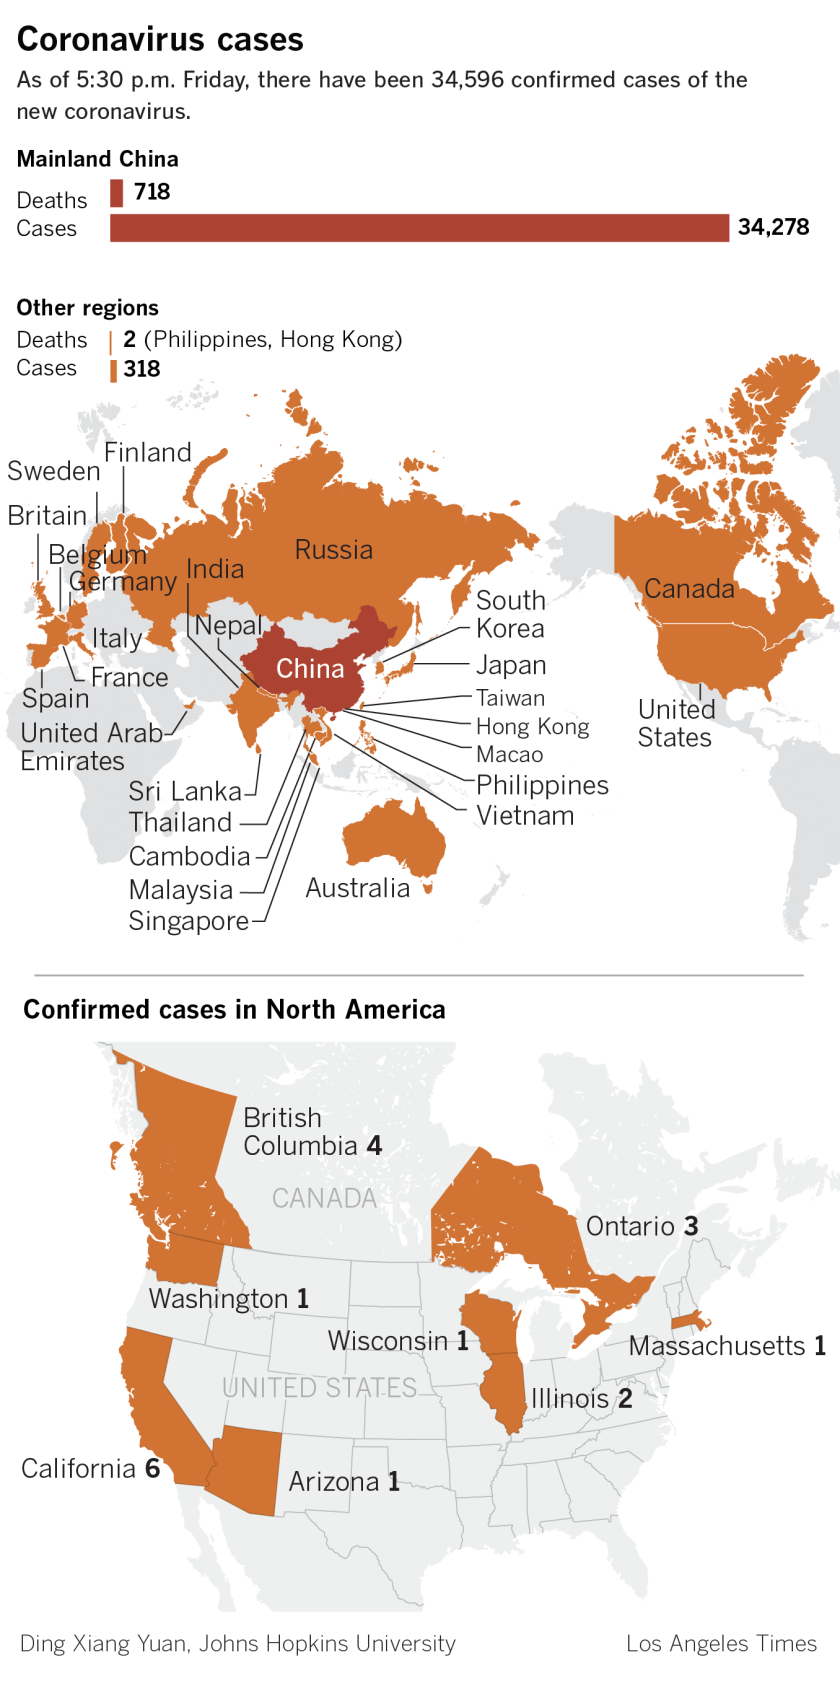
Situation reports from the World Health Organization provide an upper boundary of the mortality rate. As of Monday, there were 40,554 laboratory-confirmed infections around the world, resulting in 910 deaths. A bit of simple arithmetic indicates that slightly more than 2% of those infections were fatal.
But since the current infection count is too low, that death rate — known formally as a “case fatality rate” or “case fatality ratio” — is too high.
“That’s one thing we can pretty much say with certainty,” said Josh Michaud, who was an infectious disease epidemiologist with the Defense Department during the H1N1 influenza pandemic in 2009.
Dr. Nancy Messonnier, director of the National Center for Immunization and Respiratory Diseases at the Centers for Disease Control and Prevention, said the 2% fatality rate “has been relatively stable” so far in the outbreak. “But whether that actually is a real case fatality ratio or not, I just don’t think that we have the information right now to say.”
Advertisement

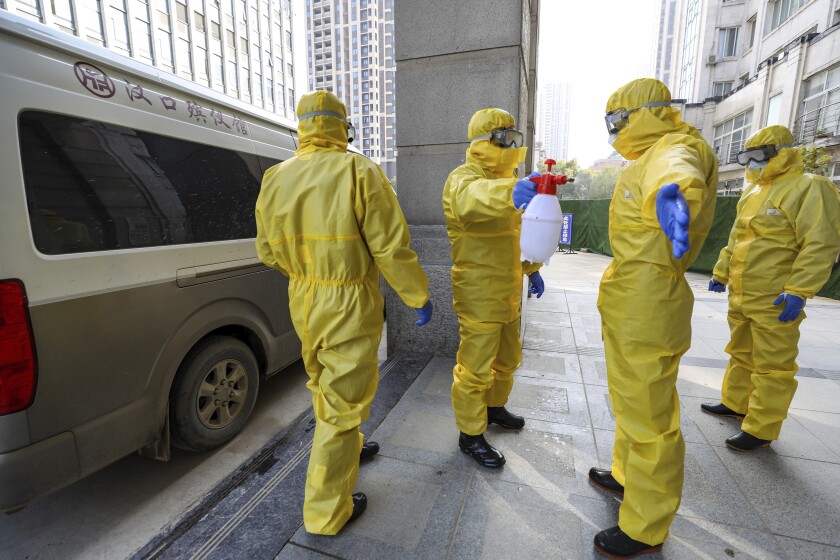
Funeral workers disinfect themselves after handling a coronavirus victim in Wuhan, China.
(Chinatopix via Associated Press)
When an outbreak involves a never-before-seen virus, there are no shortcuts epidemiologists can take to determine how many people have gotten sick and how many have died. They’ll need to dig into a variety of sources to see how many coronavirus deaths were mistakenly blamed on other causes, and vice versa. They’ll also need to figure out how many infected people never interacted with the medical system.
Researchers at Imperial College in London have modeled the infection’s spread based on the number of confirmed cases and the flow of travelers in and out of Wuhan, China, before quarantines took effect. The team assumed the virus had a five- to six-day incubation period before symptoms appeared, and that infected travelers were detected when they reached their destinations.
The result was a case count between 1,000 and 9,700 as of Jan. 18, a date when the official tally of infections was below 300. Uncertainties in the model resulted in a wide error range, but the true number of infected people was probably around 4,000, the team reported.

A doctor speaks with a patient during an online consultation session at a hospital in China’s northeastern Liaoning province.
(STR/AFP via Getty Images)
The WHO is creating its own research consortium to investigate the original source of the new strain of coronavirus and how readily it spreads. By honing in on those parameters, the WHO can make its models more accurate.
“The more time you have, the more evidence you have to work with, the better your estimate will be,” said Dr. Carlos del Rio, a global health epidemiologist at Emory University.
A good outbreak model is a lot like an iceberg, said Marc Lipsitch, an infectious disease epidemiologist at Harvard’s T.H. Chan School of Public Health.
Advertisement
The iceberg’s tip — the part you see — is the patients who die. This is the easiest number to assess for the simple reason that deaths are hard to miss.
All the other infected people are the part of the iceberg that’s underwater. Epidemiologists divide them into tiers.
Just below the surface are the patients who get sick enough to be hospitalized. Below them are patients who seek basic medical attention. The next tier is made up of people who nurse their illnesses at home, and the last is the people who have no symptoms.
In 2009, when Lipsitch was helping the CDC determine the severity of the H1N1 flu, he and his fellow researchers recognized that no single data source could capture all five tiers. So they gathered surveillance data from various parts of the U.S. health system and pieced them together to generate their iceberg model.

A hospital employee in Chicago wears a mask during the H1N1 swine flu outbreak.
(Antonio Perez / Chicago Tribune)
One key contributor was the New York City Department of Health and Mental Hygiene. Officials there didn’t try to count every single person who became infected. Instead, they focused on carefully documenting every patient who was hospitalized. Thanks to that precision, researchers could determine the relationship between hospitalizations and deaths.
Meanwhile, in the much smaller city of Milwaukee, there weren’t enough deaths to make calculations that were statistically significant. Instead, officials decided to count every single H1N1 patient who sought some kind of medical attention. Their records allowed researchers to gauge the relationship between visiting a primary care doctor and being admitted to a hospital.
At the CDC, workers conducted telephone surveys to ask people whether they had come down with flu-like symptoms around the time the outbreak began in April and May and, if so, whether they’d seen a doctor. (Luck was on their side, Lipsitch said, because anyone with a flu-like illness in the spring almost certainly had the new H1N1 strain, since the seasonal flu had subsided. That’s not the case this time, since the coronavirus took off in the midst of flu season.)
Advertisement
Within eight months, scientists had a reliable model of the H1N1 virus that included everyone except those who were infected without realizing it. To count them, researchers would need to collect blood samples from randomly selected members of the public and test them for H1N1 antibodies, a sign that the person had been exposed and their immune system had responded. But such tests were too time-consuming and expensive to justify.
In any outbreak, disease severity data tend to skew high at first, for the simple reason that the sickest patients are most noticeable.
“The patients who are worse off are more likely to seek medical care and be diagnosed,” Messonnier said.
In the early days of the H1N1 influenza pandemic, which was traced to pigs in Mexico, it looked like 10% of people infected there were dying of the flu. Then health workers identified a slew of infections so mild that people didn’t even see a doctor. Once those cases were taken into account, the death rate plunged below 0.1%, Lipsitch said.
“In the end, that flu was no more deadly than regular seasonal flu,” Michaud said.
There’s another reason experts think the coronavirus case count is off: missing data.
Whether they acknowledge it or not, the outbreak has Chinese health officials strapped for time and resources. Workers may not have the bandwidth to keep records of patients with mild infections, even though they belong in the total case count, Michaud said. Nor are there enough test kits available to diagnose every patient they suspect is infected. Even the death count — the most reliable figure — could be too low.

Samples from patients are ready to be tested for the new strain of coronavirus at a laboratory in Wuhan, China.
(STR/AFP via Getty Images)
Experts also suspect Chinese officials are withholding data that could be embarrassing to them, such as the number of medical workers who have died so far.
“We need to bring this virus out into the light so we can attack it properly,” said Tedros Adhanom Ghebreyesus, the WHO’s director-general.
Another complicating factor is that death rates for an infection can vary across the globe. Disparities in the quality of medical care are exacerbated in an outbreak, when people and resources are stretched to their limits.
“Shortages will certainly cause more deaths in Wuhan,” Del Rio said. Meanwhile, if a few dozen patients “popped up in Atlanta, they’d be treated in luxury.”

The patterns of infection outside China will be more useful for health officials around the world than any data from Beijing. The virus’ behavior in the other 27 countries and territories that have it will provide a better picture of its typical severity — and what would happen if it began spreading in the United States.
Scientists aren’t ruling out the possibility that the virus will evolve in a way that makes it more lethal, or that helps it spread from person to person (or both). But they point out that it wouldn’t be in a virus’ best interests to kill its host before it can spread to a new one.
At this point, the new coronavirus seems to have more in common with the regular flu than with exotic diseases like Ebola or Middle East Respiratory Syndrome (MERS), both of which had fatality rates around 40%. Among a group of 17,000 people with confirmed coronavirus infections, 3% were classified as critical, 15% had severe infections and 82% were mild, said Dr. Maria Van Kerkhove, the WHO’s acting head of emerging diseases. Of the 2% who died, many were elderly with underlying health issues that made them more vulnerable.
“We can say pretty confidently that this isn’t killing people left and right,” Del Rio said.
A 2% fatality rate may sound low, but it’s high enough to cause real damage in a worst-case scenario where the virus isn’t stopped.
“If you can’t contain the spread, all bets are off,” Del Rio said. “Two percent of China’s population — 28 million people — is still pretty darn high. And 2% of the world? That would be a disaster.”
"how" - Google News
February 12, 2020 at 01:40AM
https://ift.tt/2vmpxwI
How deadly is new coronavirus? Scientists race to find answers - Los Angeles Times
"how" - Google News
https://ift.tt/2MfXd3I
Bagikan Berita Ini


0 Response to "How deadly is new coronavirus? Scientists race to find answers - Los Angeles Times"
Post a Comment